How to Measure OOH Advertising ROI: Reach, Impressions, CPM & Campaign Effectiveness
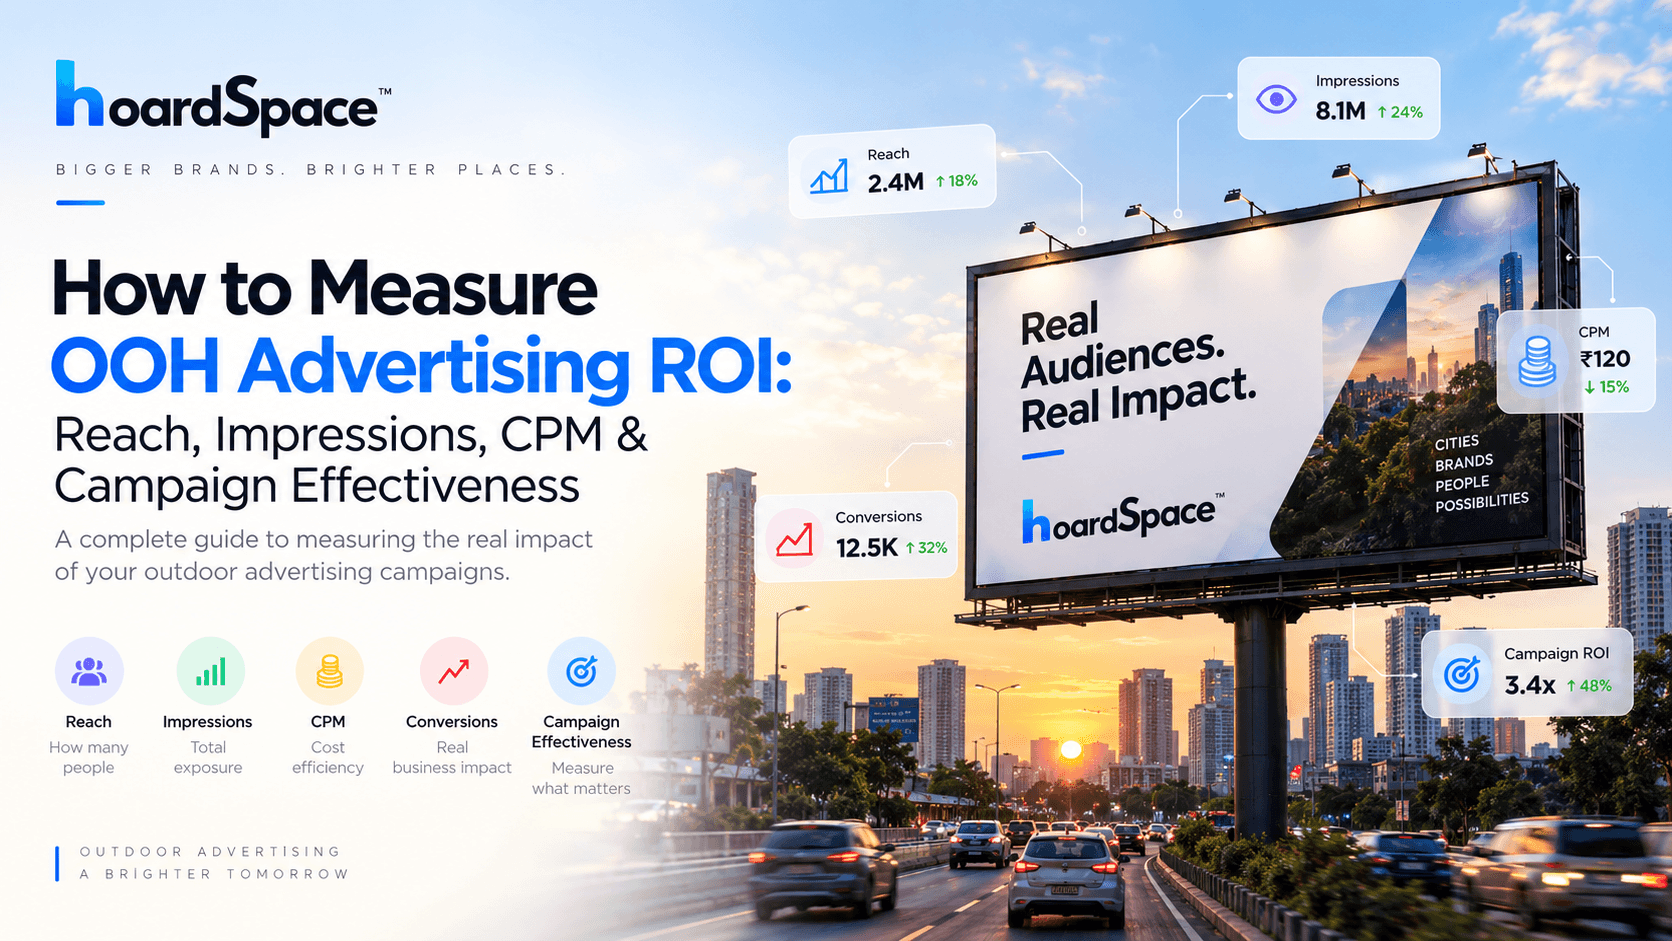
How to Measure OOH Advertising ROI: Reach, Impressions, CPM & Campaign Effectiveness
Outdoor advertising has traditionally been considered difficult to measure.
A billboard does not have a click button, a conversion pixel, or a simple dashboard showing exactly how many people saw an advertisement. But that does not mean Out-of-Home (OOH) advertising ROI cannot be measured.
With the right campaign data, advertisers can evaluate an outdoor campaign using metrics such as reach, impressions, frequency, CPM, engagement, conversions, and incremental business impact.
This guide explains how to measure OOH advertising ROI and how brands can use these metrics to make better outdoor advertising decisions.
What Is OOH Advertising ROI?
OOH advertising ROI (Return on Investment) measures the business value generated by an outdoor advertising campaign compared with the amount spent on the campaign.
At its simplest:
ROI = (Return Generated - Advertising Cost) / Advertising Cost × 100
For example, if a brand spends ₹5 lakh on an outdoor campaign and attributes ₹8 lakh of incremental profit to that campaign:
ROI = (₹8 lakh - ₹5 lakh) / ₹5 lakh × 100 = 60%
However, calculating OOH ROI is more complicated than simply comparing revenue before and after a campaign.
A proper measurement framework should consider:
- How many people were potentially exposed to the campaign
- How frequently they saw the advertisement
- Where the audience was located
- Whether the audience matched the brand's target demographic
- How much the campaign cost
- Whether brand awareness increased
- Whether website traffic, searches, leads, store visits, or sales increased
- How much incremental business can reasonably be attributed to the campaign
Why Is OOH Advertising ROI Difficult to Measure?
Digital advertising provides metrics such as clicks, impressions, conversions, and cost per acquisition.
OOH works differently.
A person may see a billboard while:
- Driving to work
- Walking through a busy market
- Waiting at a traffic signal
- Travelling through an airport
- Passing through a highway
- Commuting on public transport
There is usually no direct interaction between the viewer and the advertisement.
This means OOH measurement focuses heavily on audience exposure and statistical attribution rather than individual clicks.
The good news is that modern OOH planning can use location data, traffic data, audience research, campaign surveys, QR codes, website analytics, and sales data to build a much clearer picture of campaign performance.
The Most Important OOH Advertising Metrics
Before calculating ROI, advertisers should understand the core metrics used to measure outdoor advertising campaigns.
1. Reach
Reach refers to the estimated number of unique people exposed to an OOH campaign during a specific period.
For example:
A campaign may have an estimated reach of 500,000 people over four weeks.
Reach answers:
"How many different people could the campaign have reached?"
High reach can be particularly valuable for campaigns focused on:
- Brand awareness
- Product launches
- Market expansion
- Mass-market products
- Brand recall
However, reach alone does not tell you how many times people saw the advertisement.
2. Impressions
Impressions represent the estimated number of times an advertisement was viewed or had the opportunity to be viewed.
Suppose:
- Estimated audience = 100,000 people per day
- Campaign duration = 10 days
The campaign could generate approximately:
1,000,000 impressions
Impressions are useful for understanding the total scale of an OOH campaign.
However, impressions are generally an estimate, not a precise count of individual human views.
3. Frequency
Frequency measures the average number of times an individual is exposed to an advertisement.
The basic formula is:
Frequency = Impressions / Reach
For example:
- Impressions = 1,000,000
- Reach = 250,000
Therefore:
Frequency = 1,000,000 / 250,000 = 4
The average person in the measured audience was exposed approximately four times.
This matters because seeing an advertisement once and seeing it repeatedly can have very different effects on brand recall.
4. CPM
CPM stands for Cost Per Thousand Impressions.
It is one of the most useful metrics for comparing the cost efficiency of different OOH campaigns.
CPM Formula
CPM = Campaign Cost / Impressions × 1,000
For example:
- Campaign cost = ₹2,00,000
- Estimated impressions = 1,000,000
Therefore:
CPM = ₹2,00,000 / 1,000,000 × 1,000
CPM = ₹200
This means the advertiser paid approximately ₹200 for every 1,000 estimated impressions.
Why CPM Matters in OOH Advertising
CPM allows advertisers to compare different advertising opportunities using a common cost-efficiency metric.
Consider two billboard options:
| Metric | Billboard A | Billboard B |
|---|---|---|
| Campaign Cost | ₹2,00,000 | ₹3,00,000 |
| Estimated Impressions | 1,000,000 | 2,500,000 |
| CPM | ₹200 | ₹120 |
Although Billboard B costs more in absolute terms, it generates a lower estimated CPM.
This demonstrates an important principle:
The cheapest billboard is not necessarily the most cost-effective billboard.
Advertisers should evaluate cost relative to audience exposure and audience quality, not just the rental price.
5. Cost Per Reach
CPM focuses on impressions.
Cost per reach focuses on the number of unique people reached.
Formula
Cost Per Reached Person = Campaign Cost / Reach
For example:
- Campaign cost = ₹5,00,000
- Reach = 1,000,000 people
Cost per reached person:
₹5,00,000 / 1,000,000 = ₹0.50
This can help advertisers understand how efficiently a campaign expands its audience.
6. Gross Rating Points (GRPs)
GRP, or Gross Rating Point, is another traditional advertising measurement used to represent the total weight of a campaign against a defined target audience.
A simplified formula is:
GRP = Reach (%) × Average Frequency
For example:
- Reach = 40%
- Average frequency = 5
Therefore:
GRP = 40 × 5 = 200 GRPs
GRPs can be useful when comparing campaign weight across different media channels.
7. Audience Quality
Not all impressions are equally valuable.
Suppose a premium skincare brand receives:
- 2 million impressions from a largely irrelevant audience
- 1 million impressions from an audience that closely matches its target customers
The second campaign may produce better business results despite generating fewer impressions.
Therefore, OOH campaign measurement should consider factors such as:
- Age
- Gender
- Income profile
- Location
- Occupation
- Lifestyle
- Consumer behaviour
- Travel patterns
- Purchasing power
This is where audience targeting becomes more important than simply maximizing impressions.
How to Calculate OOH Advertising ROI
A basic ROI calculation can be expressed as:
ROI = (Incremental Return - Campaign Cost) / Campaign Cost × 100
The difficult part is determining the incremental return.
You need to answer:
"What additional business happened because of the campaign?"
This requires more than looking at total sales.
Step 1: Establish a Baseline
Before launching an OOH campaign, establish a baseline for relevant business metrics.
Depending on the campaign, this could include:
- Website traffic
- Branded search volume
- Store visits
- App downloads
- Leads
- Sales
- Enquiries
- QR code scans
- Phone calls
- Product trials
- Social media activity
For example, suppose a brand normally receives:
10,000 website visits per week
Before the campaign, record this baseline.
Step 2: Track Changes During the Campaign
After launching the campaign, monitor the same metrics.
Suppose website traffic increases to:
15,000 visits per week
There is now a 5,000-visit increase.
But that does not automatically mean the billboard generated all 5,000 visits.
Other factors could include:
- Search advertising
- Social media campaigns
- Influencer marketing
- Organic growth
- Seasonal demand
- News coverage
- Promotions
This is why attribution matters.
Step 3: Use Trackable Campaign Elements
One of the easiest ways to measure direct response from OOH is by adding trackable elements.
These can include:
QR Codes
A billboard can include a QR code leading to a dedicated landing page.
Track:
- QR scans
- Landing page visits
- Sign-ups
- Leads
- Purchases
Dedicated URLs
Instead of using the main website URL, an advertiser can create a campaign-specific URL.
For example:
brand.com/billboard
Traffic to this URL can then be measured separately.
Promo Codes
A campaign-specific promo code can help connect purchases to the campaign.
For example:
OOH20
Every transaction using the code can be tracked.
Dedicated Phone Numbers
A unique phone number can be displayed on the campaign creative.
Incoming calls can then be attributed more directly to the campaign.
Step 4: Measure Brand Lift
Not every OOH campaign is designed to generate immediate sales.
Many campaigns are designed to increase:
- Brand awareness
- Brand recall
- Product awareness
- Consideration
- Purchase intent
For these campaigns, brand lift studies can be more appropriate than direct-response metrics.
A survey can compare people who were exposed to the campaign with a relevant control group.
Questions can measure:
- Have you heard of this brand?
- Do you remember seeing this advertisement?
- What brands come to mind in this category?
- How likely are you to consider this brand?
- How likely are you to purchase from this brand?
This helps measure changes that may occur before a purchase happens.
Step 5: Compare Exposed and Unexposed Areas
One useful approach is to compare locations where the campaign ran with similar locations where it did not.
For example:
Campaign areas
- Delhi
- Mumbai
- Bengaluru
Control areas
- Jaipur
- Pune
- Hyderabad
If the markets are sufficiently comparable, changes in:
- Sales
- Website traffic
- Searches
- Store visits
- Leads
can be analyzed between the two groups.
This can provide stronger evidence of incremental impact than simply comparing sales before and after the campaign.
OOH Attribution: Connecting Billboards to Business Results
Attribution is one of the hardest parts of measuring OOH ROI.
A customer might:
- See a billboard in the morning
- Search for the brand later
- Visit the website that evening
- Compare products
- Purchase two days later
The final purchase may not contain an obvious signal saying:
"This customer came from a billboard."
Therefore, OOH attribution often works by combining multiple signals.
These may include:
- Location data
- Campaign exposure estimates
- Search trends
- Website analytics
- QR scans
- Sales data
- Store visits
- Survey responses
- Geographic experiments
The objective is not to pretend every conversion can be tracked perfectly.
The objective is to estimate the incremental impact of the campaign as accurately as possible.
Measuring OOH Campaign Effectiveness
ROI is only one part of campaign evaluation.
A strong OOH measurement framework should evaluate the campaign across multiple dimensions.
1. Exposure
Measure:
- Reach
- Impressions
- Frequency
- GRPs
2. Cost Efficiency
Measure:
- CPM
- Cost per reached person
- Cost per target audience reached
3. Audience Quality
Measure:
- Demographic fit
- Geographic fit
- Consumer profile
- Target audience concentration
4. Engagement
Measure:
- QR scans
- Website visits
- Search volume
- Social activity
- Calls
- Leads
5. Business Impact
Measure:
- Sales
- Leads
- Store visits
- App installs
- Revenue
- Customer acquisition
6. Brand Impact
Measure:
- Awareness
- Recall
- Consideration
- Purchase intent
Together, these metrics provide a much more complete picture of campaign performance.
Example: Measuring a Billboard Campaign
Suppose a brand runs a 30-day OOH campaign.
Campaign Data
| Metric | Value |
|---|---|
| Campaign Cost | ₹10,00,000 |
| Estimated Reach | 20,00,000 |
| Estimated Impressions | 50,00,000 |
| Average Frequency | 2.5 |
| QR Scans | 25,000 |
| Leads | 2,000 |
| Attributed Customers | 500 |
| Average Customer Value | ₹4,000 |
Estimated revenue from attributed customers:
500 × ₹4,000 = ₹20,00,000
If the advertiser determines that the ₹20 lakh represents genuinely incremental revenue, then:
ROI = (₹20,00,000 - ₹10,00,000) / ₹10,00,000 × 100
ROI = 100%
But there is an important caveat.
The ₹20 lakh should not automatically be treated as incremental revenue simply because the customers interacted with the campaign.
Attribution methodology matters.
Why Location Matters in OOH ROI
The same creative can perform very differently depending on where it is placed.
A billboard near:
- A major highway
- An airport
- A shopping district
- A business district
- A residential area
- A college area
can reach very different audiences.
Therefore, billboard selection should consider more than visibility.
Important location factors include:
- Traffic volume
- Pedestrian movement
- Visibility
- Dwell time
- Direction of traffic
- Nearby landmarks
- Audience demographics
- Socioeconomic profile
- Competition
- Proximity to stores
- Proximity to target locations
A high-traffic location that reaches the wrong audience may generate a large number of impressions but relatively little business value.
Reach vs Impressions: Which One Matters More?
Neither metric should be considered in isolation.
Reach
Useful when the objective is:
"I want to introduce my brand to as many unique people as possible."
Impressions
Useful when the objective is:
"I want repeated exposure and stronger campaign frequency."
For example:
Campaign A
- Reach: 1 million
- Impressions: 1.5 million
- Frequency: 1.5
Campaign B
- Reach: 600,000
- Impressions: 2.4 million
- Frequency: 4
Campaign A reaches more unique people.
Campaign B creates more repeated exposure.
Which approach makes sense depends on the campaign objective.
How to Compare Two Billboard Locations
Suppose you are choosing between two locations.
| Metric | Location A | Location B |
|---|---|---|
| Monthly Cost | ₹1,50,000 | ₹2,00,000 |
| Estimated Impressions | 8,00,000 | 15,00,000 |
| Estimated Reach | 4,00,000 | 7,00,000 |
| CPM | ₹187.50 | ₹133.33 |
| Target Audience Fit | Medium | High |
Location B costs more, but its estimated audience exposure and target audience fit may justify the higher absolute cost.
This illustrates why billboard selection should be based on campaign objectives and audience economics, rather than price alone.
AI and Data Are Changing OOH Measurement
Modern OOH platforms can combine large amounts of data to make campaign planning more measurable.
AI can help analyze:
- Billboard locations
- Audience demographics
- Traffic patterns
- Historical campaign performance
- Geographic demand
- Industry suitability
- Estimated reach
- Estimated impressions
- Campaign costs
- Target audience concentration
For example, an advertiser could ask:
"Find billboard locations in Bengaluru that can reach working professionals aged 25-40 within a ₹10 lakh budget."
An intelligent OOH platform can evaluate available inventory and identify locations that match the campaign requirements.
This moves OOH planning from simply buying advertising space to data-driven media planning.
How HoardSpace Helps Advertisers Evaluate OOH Inventory
HoardSpace brings outdoor advertising inventory into a centralized digital marketplace, making it easier for brands and agencies to discover and compare outdoor advertising opportunities.
Advertisers can explore billboard inventory based on factors such as:
- Location
- Pricing
- Dimensions
- Media type
- Audience demographics
- Estimated reach
- Visibility
- Nearby landmarks
- Campaign requirements
Instead of evaluating billboards only by their physical location, advertisers can compare inventory using multiple campaign-relevant attributes.
With data-driven tools and AI-assisted planning, OOH media buying can become more transparent and measurable.
A Practical OOH ROI Measurement Framework
For every campaign, advertisers can follow this framework:
Before the Campaign
- Define the campaign objective.
- Identify the target audience.
- Select relevant OOH locations.
- Estimate reach and impressions.
- Calculate expected CPM.
- Establish business and brand baselines.
- Set up tracking mechanisms.
During the Campaign
- Monitor campaign delivery.
- Track estimated exposure.
- Monitor QR scans and website traffic.
- Track branded search activity.
- Monitor leads and enquiries.
- Record campaign spend.
After the Campaign
- Compare campaign performance against the baseline.
- Measure incremental traffic and sales.
- Analyze audience exposure.
- Measure brand lift where applicable.
- Calculate CPM and cost efficiency.
- Estimate incremental revenue.
- Calculate ROI.
- Compare results with previous campaigns.
OOH Advertising ROI: The Metrics That Matter
A useful OOH campaign dashboard could include:
| Category | Metrics |
|---|---|
| Reach | Unique people reached |
| Exposure | Impressions |
| Frequency | Average exposures per person |
| Cost | Campaign spend |
| Efficiency | CPM |
| Audience | Demographic and geographic fit |
| Engagement | QR scans, visits, searches |
| Conversion | Leads, purchases, store visits |
| Brand | Awareness, recall, consideration |
| Financial | Incremental revenue |
| ROI | Return relative to campaign cost |
The important point is that no single metric can fully describe OOH campaign performance.
Common Mistakes When Measuring OOH ROI
1. Treating Impressions as Actual Purchases
An impression means exposure, not conversion.
High impressions do not automatically mean high sales.
2. Looking Only at Billboard Price
A cheaper billboard may have:
- Lower traffic
- Lower visibility
- Lower target audience concentration
- Lower reach
The correct comparison is cost relative to expected campaign value.
3. Ignoring Frequency
Reaching 1 million people once is different from reaching 500,000 people multiple times.
Frequency should be evaluated alongside reach.
4. Measuring Only Immediate Sales
OOH can influence people long before they purchase.
A campaign can increase:
- Brand awareness
- Search activity
- Consideration
- Store visits
- Future purchases
Therefore, measuring only immediate conversions can underestimate its impact.
5. Ignoring Other Marketing Channels
If a brand runs OOH, Google Ads, Meta Ads, influencer campaigns, and email marketing simultaneously, a rise in sales cannot automatically be attributed entirely to OOH.
A proper measurement approach should account for other marketing activity.
What Makes a Good OOH Campaign?
A successful OOH campaign generally combines:
The right audience + the right location + the right creative + sufficient exposure + measurable business objectives
A billboard should not be evaluated only on whether it looks impressive.
The more useful question is:
Did the campaign efficiently reach the right people and contribute to the desired business outcome?
That is the foundation of measurable OOH advertising.
Final Thoughts
OOH advertising is no longer limited to buying a billboard and hoping that people notice it.
Advertisers can now use reach, impressions, frequency, CPM, audience data, location intelligence, engagement signals, brand lift studies, and sales data to evaluate campaign performance.
The most important principle is to connect every campaign back to its objective.
If the objective is awareness, focus on reach, frequency, audience quality, and brand lift.
If the objective is performance, track measurable actions such as QR scans, website visits, leads, store visits, and sales.
If the objective is profitability, connect incremental business outcomes to campaign expenditure and calculate ROI.
The future of OOH advertising is increasingly data-driven, measurable, and intelligent.
With platforms such as HoardSpace, advertisers can discover and compare outdoor advertising inventory using data rather than relying solely on traditional media-buying processes.
The billboard is still physical.
The decision-making behind it does not have to be.
Frequently Asked Questions
What is OOH advertising ROI?
OOH advertising ROI measures the business return generated by an outdoor advertising campaign relative to the campaign's cost.
How is OOH CPM calculated?
The basic formula is:
CPM = Campaign Cost / Estimated Impressions × 1,000
What is the difference between reach and impressions?
Reach represents the estimated number of unique people exposed to a campaign, while impressions represent the estimated total number of exposures.
How can I track conversions from a billboard?
Advertisers can use QR codes, dedicated URLs, promo codes, campaign-specific landing pages, phone numbers, surveys, and geographic analysis to track campaign responses.
Can OOH advertising generate measurable ROI?
Yes. OOH ROI can be measured by combining exposure metrics such as reach and impressions with engagement, brand, conversion, sales, and incremental business data.
Is CPM enough to evaluate a billboard?
No. CPM measures cost efficiency based on estimated impressions, but advertisers should also consider audience quality, location, visibility, frequency, campaign objectives, and business outcomes.
How does location affect OOH advertising ROI?
Location affects the volume and type of audience exposed to an advertisement. Traffic, visibility, demographics, dwell time, nearby businesses, and geographic context can all influence campaign effectiveness.
Can AI improve OOH campaign planning?
Yes. AI can help analyze inventory, audience characteristics, location data, estimated reach, campaign budgets, and other variables to identify outdoor advertising opportunities that align with campaign objectives.
Plan Your Next OOH Campaign With HoardSpace
Looking for outdoor advertising opportunities across India?
Explore billboard and outdoor advertising inventory on HoardSpace and compare media opportunities based on location, audience, pricing, and campaign requirements.
Explore Outdoor Advertising with HoardSpace → https://hoardspace.in